The problem is, infographics require a certain amount of research beforehand. You can end up sinking a couple of days into making one infographic from scratch. Odds are, if you’re a busy person, you don’t have the time to do this. But you don’t have to do that! Instead, recycle information from a blog post into an infographic. All of the information you need is already there in the blog post, all you have to do is condense it and visualize it. What’s more, if you want to promote a blog post you’ve written on social media, creating an infographic is a great way to pull in readers because:
You can share the infographic on social media. You can email the infographic to people. You can offer readers the embed code for the infographic so they can post it on their own sites.
Here is how you can turn a blog post into an infographic.
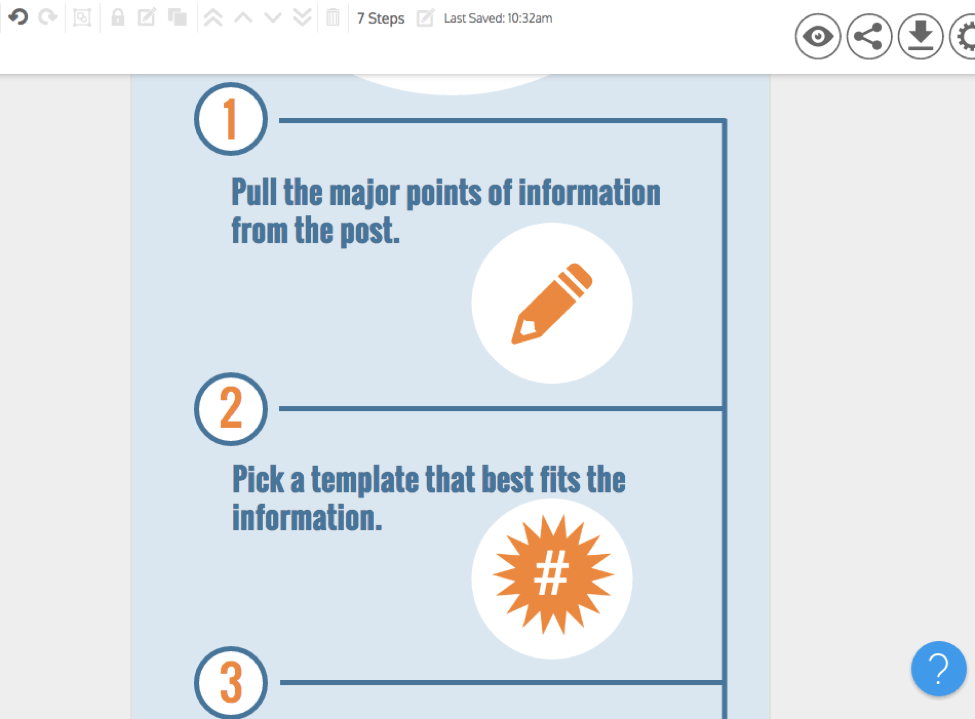
1. Pull the major points of information from the post.
Infographics are not text heavy, relying instead on visual representations of information like charts, pictograms, and illustrations. You won’t be able to include all of your blog post text into your infographic and anyway, it would defeat the purpose. All you need is the key information. A good way to pull the key information is to ask yourself: what is the central question your blog post seeks to answer? Make that question and answer the focus of your infographic. If there are one or two major statistics, focus your infographic on those. Take this blog post for example. It’s already divided up into seven numbered points, so that structure can be used to organize the content in an infographic.
2. Pick a template that best fits the information.
Using a template can save to between 10 to 20 hours of design time than if you were to create an infographic from scratch. Using a template handles the bulk of the organization of information and design elements, so all you have to worry about is personalizing the design. There are a number of sites that offer free templates for infographics. The type of template you use will depend on the type of information you are presenting. For example, if your infographic covers information over a period of time, a timeline template works well. Or if your infographic compares two sets of information, a comparison template with two columns of information is an effective layout. In the case of an infographic made from this article, which has numbered steps, a process infographic template will work well.
3. Condense the introduction.
An infographic should be able to stand on its own, without readers needing to read the blog post for clarification. Because of that, you will need to introduce the concept to readers in a condensed way. Pull the key idea from the introduction (similar to how you would pull the key thesis sentence from an essay) and make that your intro. Condensing the introduction will probably require some rephrasing.
4. Reduce text by using charts and graphs.
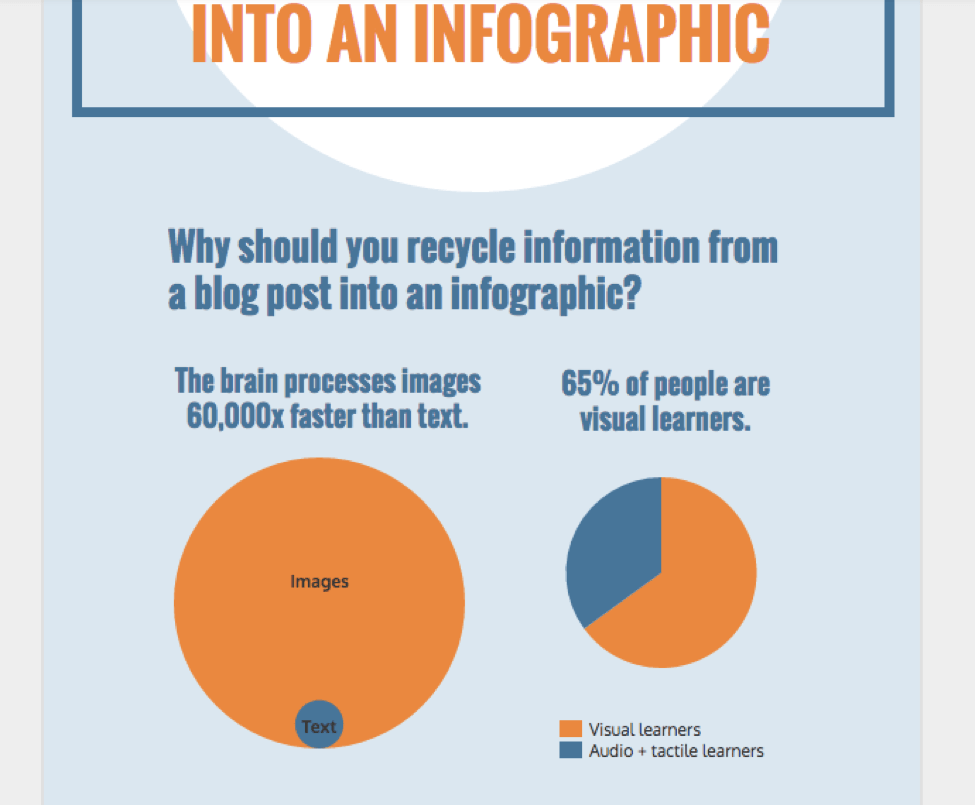
Infographics are a visual medium so when you have the option to present information using a chart or graph, do it. For example, if your blog post discusses different categories of a topic, you could turn that into a bar graph. Or if you’re showing how parts make up a whole, you could use a pie chart. In the case of this article, I cited two major statistics at the beginning: 1) the brain processes images 60,000x faster than text, and 2) 65% of people are visual learners. The first statistic can be turned into a stacked bubble chart and the second statistic can be made into a pie chart.
Even including single charts in your blog post will offer readers a visual way to process information. If you don’t have much experience creating data visualizations, consider using a chart maker with preset styles.
5. Make the infographic design cohesive with visuals in the blog post and your blog’s branding.
While the information in your infographic should allow it to be circulated without the blog post to contextualize it, it should still complement the blog post when presented together. If there are any images that are particularly important in the blog post, include them in the infographic as well. To make the images fit into the infographic design, crop and frame the image. If you want to maintain consistent branding across your blog and all related graphics, you may also want to use your blog’s color scheme in the infographic. The same goes for font style and images. Don’t forget to include your blog’s logo, the URL to your blog, or the name of the specific post the infographic is based on. One of the main purposes of an infographic is to offer readers a graphic that can be shared easily across multiple platforms–but you don’t want to burn the trail back to your blog! Sites will typically place their logo either at the bottom or directly at the top of their infographic.
6. Cite your information.
Don’t forget to include the link to your original blog post on the infographic! But beyond that, it’s good practice to include links to the page you pulled your information from, or, at least, the title of the websites. Citing information not only show accountability, it also educates readers on where they can go to find more information on the topic, if they’re interested. List your blog post first to indicate that it’s the primary source, the first place they should go for more.
7. Offer the embed code under the infographic.
This step is optional but it’s a good idea. If you don’t offer an embed code, people can still save the infographic and share it on their own pages, but they might not link back to your blog (that’s why you shouldn’t forget to brand your infographic). If you offer an embed code, however, then not only will they be sharing the infographic on your terms, but you will also be able to include a link to your blog in the actual code. Here is an embed code you can use on WordPress: <a title=“TITLE OF INFOGRAPHIC” href=“BLOG POST URL”> <img src=“IMAGE URL” alt=“TITLE OF INFOGRAPHIC” /> TITLE OF INFOGRAPHIC <a href=“BLOG URL” style=”color: #C7C5C5; text-decoration: none; font-style: italic;”>BLOG NAME You don’t have to be a master designer to make solid infographics. When in doubt, follow the steps laid out on this infographic: